Exposure Is a Graph, Not a Spreadsheet
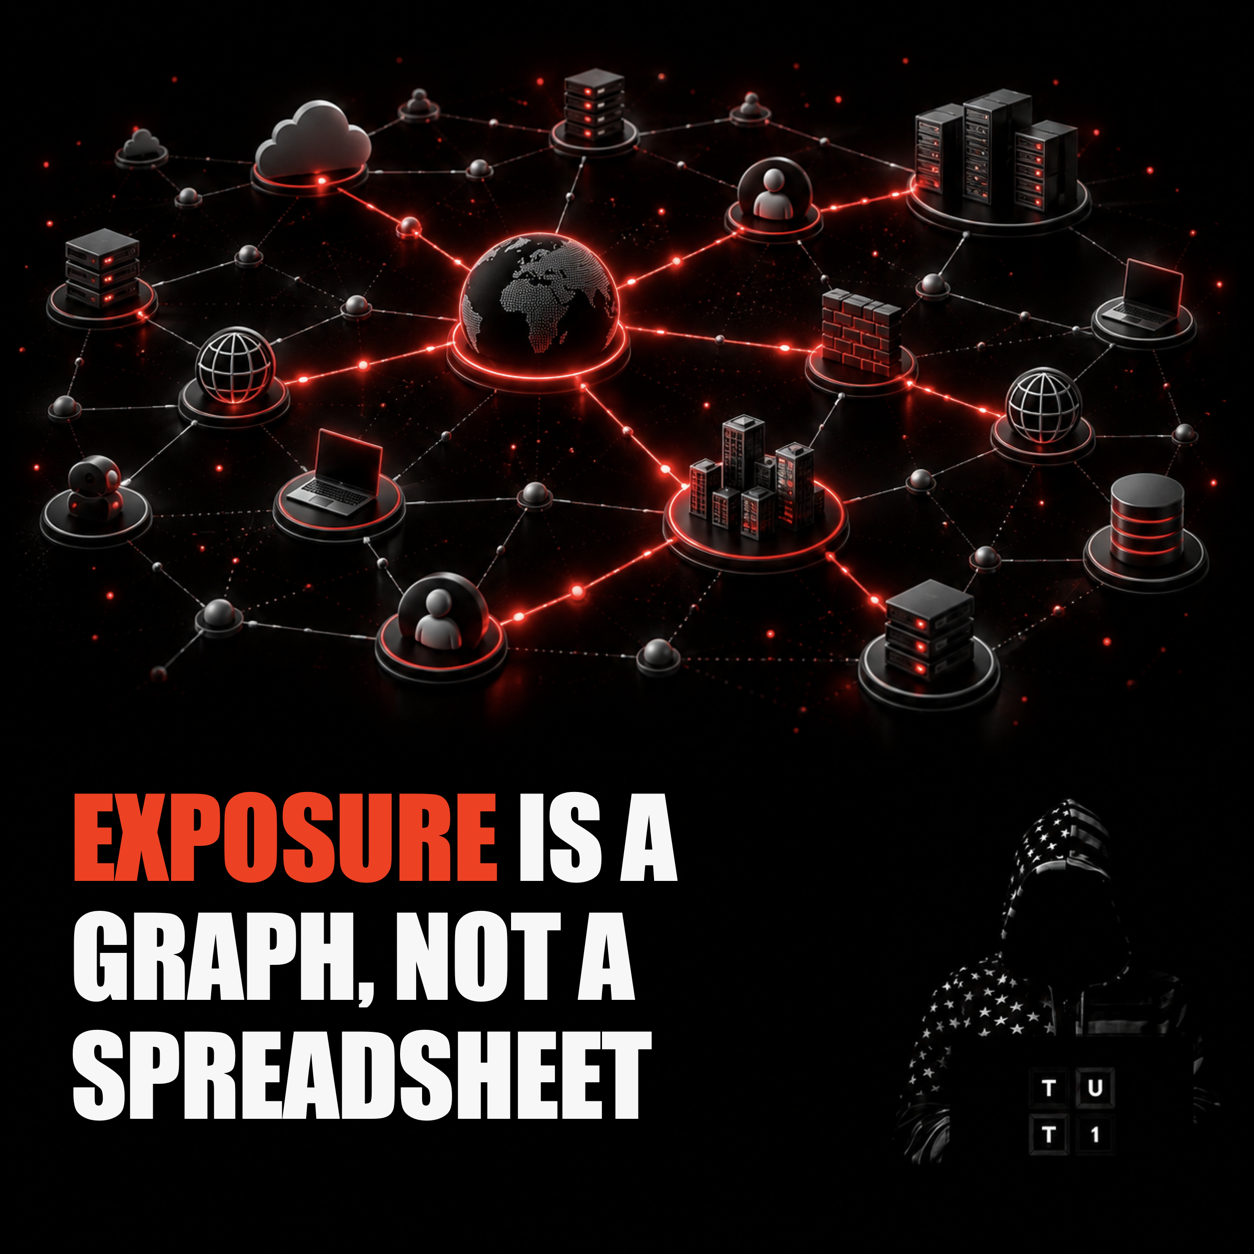
Spreadsheets list assets. Security decisions depend on relationships.
A domain points to subdomains. Subdomains resolve to IPs. IPs expose services. Services present certificates. Certificates reveal names. Identities access portals. Suppliers connect to business processes. A single high-risk path can cross all of these layers.
That is why attack-surface management benefits from graph thinking. It helps teams see concentration: one provider supporting many critical domains, one legacy service linked to several identities, or one unowned certificate pointing to an unexpected application.
The goal is not visual complexity. It is clearer prioritization through connection and context.
Risk rarely lives in a row. It lives in the relationship between rows.
TUT1 maps the relationships across domains, subdomains, IPs, services, certificates, and digital-risk signals to make external exposure easier to understand and act on.
Primary topic · attack surface graph analysis